30 Days to a Successful AI Inspection Pilot: A How-To
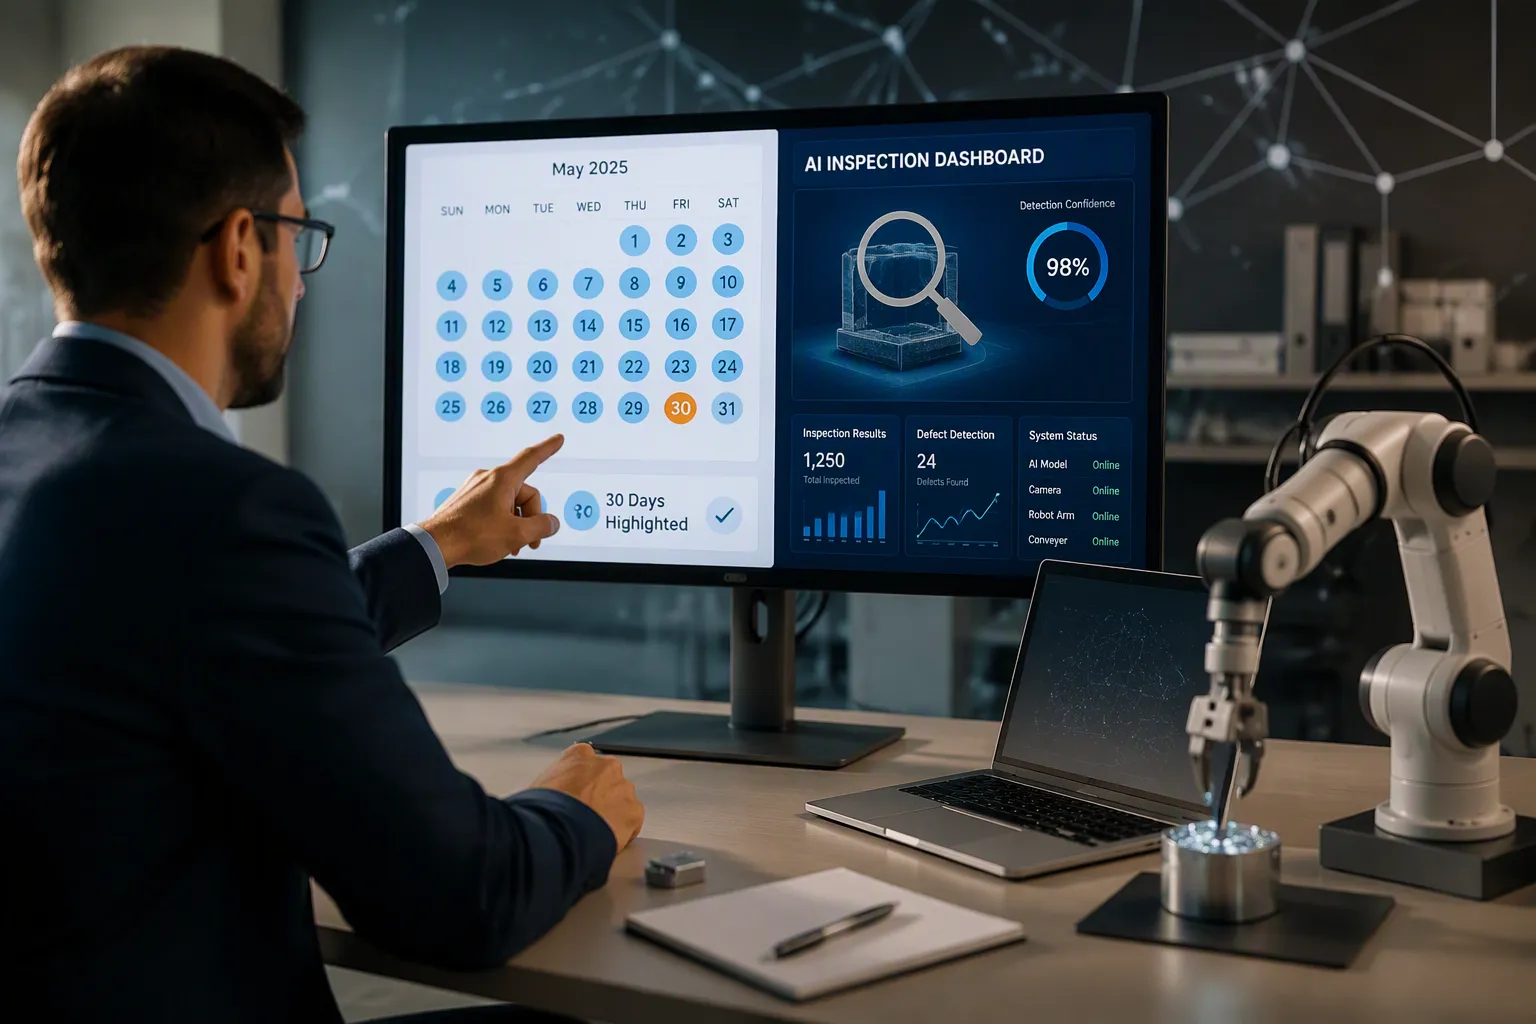
46% of enterprise AI proofs-of-concept are abandoned before deployment.
How can you ensure your pilot ai inspection system delivers real value in a 30-day pilot? A successful ai pilot requires a structured 30-day plan with clear success criteria and roi. You do not need new cameras or data scientists. This plan guides you from problem selection to a go/no-go decision. The primary goal is learning. You will test your ai vision pilot in real conditions. Vision and inspection quality metrics drive decisions. Training the model is part of the process. Production readiness will be evaluated. By week four, you know if the pilot delivers value.
Week 1: Define Your Pilot AI Inspection System Scope
Selecting a Single, High-Impact Problem
Your pilot ai inspection system needs one clear problem to solve. Do not try to fix every defect on every line at once. A focused scope gives you a clear signal after 30 days. You can evaluate success when you limit the variables.
Start with one production line. Choose the line with the highest rejection rate or rework cost. This selection gives you the fastest and clearest ROI signal. Pick a stable product type that does not change during the pilot. A consistent product lets your model learn without confusing variations. Select a line with moderate speed. The fastest or most complex line adds unnecessary risk during validation.
| Recommendation | Why It Matters |
|---|---|
| High defect-cost line | Highest quality rejection or rework cost gives the clearest ROI signal |
| Stable product type | Consistent product prevents the model from generalizing too early |
| Moderate line speed | Easier to validate than the fastest or most complex line |
| No mid-pilot changes | New product mid-pilot invalidates the baseline and accuracy trend |
Document your pilot scope on one page. Include the business problem, the decision you will make at the end, your hypothesis, and your baseline metrics. Define your success criteria before you start. Know what results mean go, pivot, or stop. Exclude everything outside this single problem. Keep the scope narrow but meaningful.
Starting too big: Your first pilot should prove the concept, not change everything. Pick one line, one process, one piece of equipment.
Involve the operators on that line. They understand the defects better than anyone else. Their buy-in makes your ai vision pilot stronger from day one.
Setting Up Cameras and Collecting Initial Images
You do not need new cameras. Most facilities already have the hardware you need. Leverage your existing camera infrastructure for this pilot. The integration into your current workflow takes hours, not weeks. Your goal is to collect images, not install new equipment.
Collect a diverse set of images. Capture normal parts and defective parts. Your model needs to see both good and bad examples. For most defect classes, you need 200 to 500 labeled examples per class. For anomaly detection, start with 100 to 200 good-part images. Data quality matters more than quantity. Clear, well-lit images with consistent framing give your model the best start.
Your vision system needs images that reflect real production conditions. Include different lighting angles, part orientations, and conveyor speeds. A dataset that matches your actual workflow trains a better model. Collect images without disrupting production. Let the system capture data while your team continues manual inspection. You will use these images in Week 2 for labeling and training.
Week 2: Label, Train, and Calibrate Your Model
Labeling Data and Training the Initial Model
Labeling turns raw images into a lesson plan for the model. This step needs domain expertise. Your quality team knows the difference between a true defect and a harmless variation. They should lead the labeling process. Generic annotators might flag harmless variations as defects. Experienced operators label only the real defects. This precision reduces false positives later.
An electronics manufacturer needed a computer vision model for PCBA solder joint inspection. They looked for seven defect types. Their team collected and labeled the data in under an hour. You can move fast too. Focus on data quality first. A small set of accurately labeled images beats a large set of sloppy labels. It focuses the model on one specific defect.
Start model training after you label the first batch. Training is an iterative process. You feed the model the labeled images. It learns to recognize patterns. You review the results and adjust. You do not need a data science team. The ai vision pilot guides you. Your goal for model training is a stable baseline. It catches the target defect consistently. Achieve this before you move to calibration.
Conducting Calibration and Baseline Testing
Calibration checks how well your model performs on unseen data. You hold back a portion of your labeled images during training. You use this set for testing. The process measures generalization ability. A model only remembers the training images. It fails on new parts.
Run several validation cycles. Adjust the sensitivity. A sensitive model catches more defects. It may increase false positives. A strict model misses fewer false alarms. It might let defects pass. Find the right balance for your line. Your validation accuracy tells you if the model is ready.
Baseline testing gives a performance snapshot. Record the model defect detection rate and false positive rate. Compare these to your manual inspection baseline. This data guides your decision in Week 4. Once you have a stable baseline, you are ready for the shadow run. The model does not need to be perfect. It needs to be consistent. This validation step builds trust for the next phase.
Week 3: Shadow Running for Inspection Validation
Implementing the Parallel Run with Manual Inspection
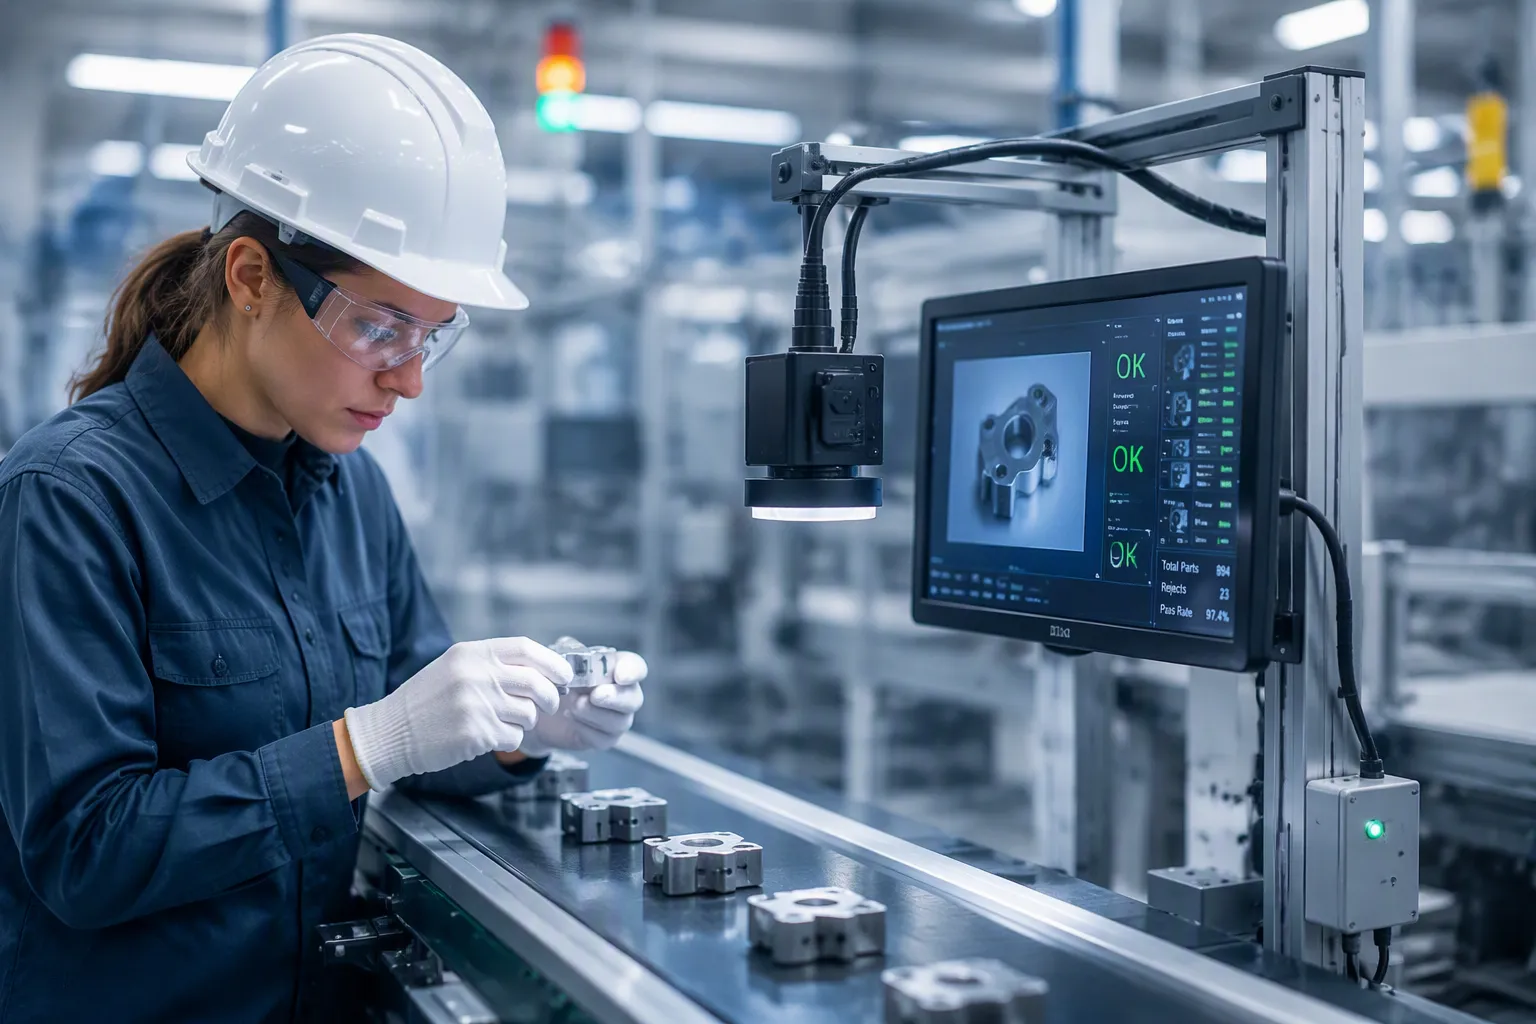
Shadow running places your model alongside your human inspectors. The model watches every part. It records its judgments. It does not stop the line or trigger alarms. Your team continues their normal routine. This parallel run creates a safe space for comparison.
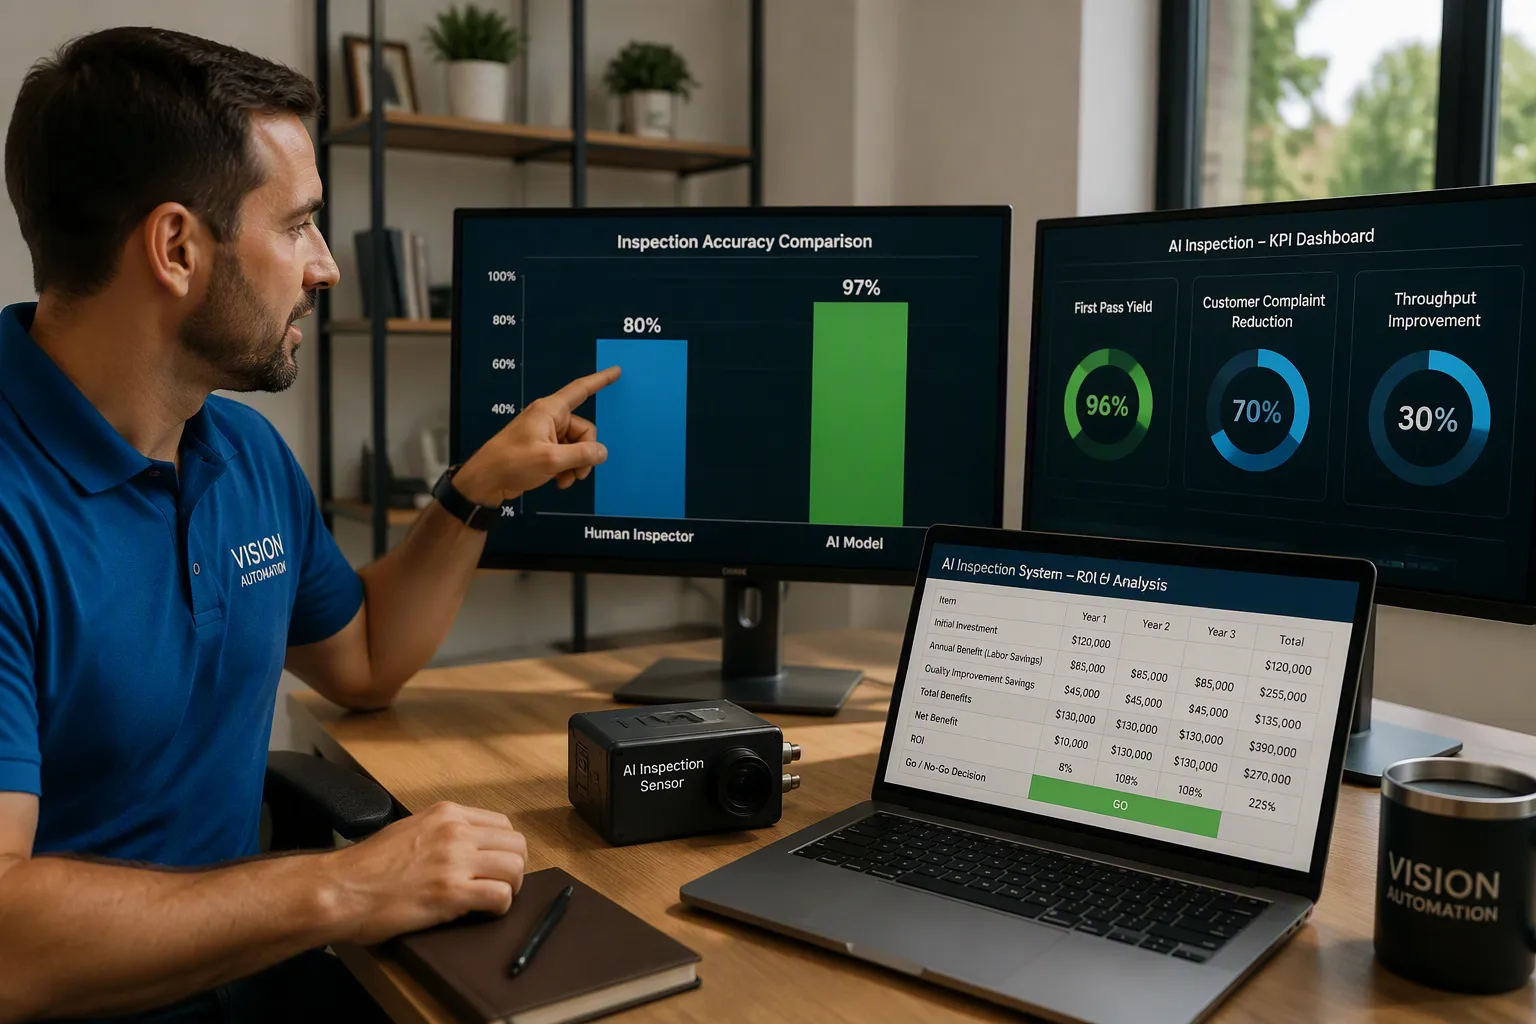
You will compare the model's calls against your inspectors' findings. This comparison reveals the true capability of your pilot ai inspection system. Research from Sandia National Laboratories shows that even the best human inspectors catch only 80% of defects at peak performance. Two inspectors working together achieve just 96% combined accuracy. Your model typically operates in the 97-99% range. The gap becomes visible during this week.
| Metric | Manual Inspection | AI/Computer Vision |
|---|---|---|
| Detection Accuracy | 60-80% | 97-99% |
| Consistency | Fatigue after 20-30 min; inconsistent between shifts | 24/7 consistent operation |
| Missed Defects | 20-40% | <3% false positives |
| Throughput | 10-50 parts/hour | 1,000+ parts/hour |
A human inspector at hour 7 of a shift is not the same inspector as at hour 1. Accuracy degrades measurably after 20-30 minutes of repetitive tasks. Your model applies identical parameters at minute 1 and minute 480. The shadow run shows this contrast clearly. Manual accuracy drifts downward over each shift. Your model holds its accuracy ceiling all day.
Expect a phase called "tourist traffic" during the first days. Employees will test your system with trick questions. They will hold up unusual parts. They might try to fool the camera with shadows or reflections. This behavior is normal. People want to find the limits of the new tool. Let them explore. Answer their questions honestly. When the novelty fades, the trick questions stop. You will know this phase ends when your team returns to their normal pace. The questions shift from "can it catch this?" to "how do we fix this issue?" That shift signals genuine adoption.
Gathering Feedback and Refining Model Performance
Real-world feedback drives your model's improvement. Your operators see things your training data never showed them. Their input identifies edge cases you missed. Collect this feedback systematically during the shadow run.
Use multiple feedback channels. Direct feedback comes from explicit input like comments or survey responses. Indirect feedback comes from behavioral metrics like error frequencies and task completion rates. Progressive feedback starts with a quick binary option, such as "Was this call correct?" Then it offers an opportunity for detailed input. Contextual feedback prompts tie questions to specific interactions. For example, "This part showed a false positive. What caused it?" Automated tools like AI-powered surveys capture real-time responses and integrate them into your workflow.
Each piece of feedback becomes a candidate for retraining. A false positive on a specific connector type tells you the model needs more examples of that connector. A missed defect on a scratched surface tells you the model needs better lighting examples for that pattern. Log every edge case. Tag each one with the operator's notes. This collection becomes your retraining dataset.
Run a short retraining cycle mid-week. Feed the new examples into the model. Test the updated version against your validation set. Confirm the changes improve performance without breaking existing detections. This iterative refinement is the heart of model training during a shadow run. You do not need a data science team for this work. The process follows a simple loop: collect feedback, label examples, retrain, test, repeat.
By Friday, you will have a refined model with real production experience. You will also have documented evidence of its performance against manual inspection. This evidence feeds directly into your Week 4 ROI calculation. The shadow run transforms your ai vision pilot from a lab experiment into a production-ready tool. Your integration into the workflow becomes smoother with each refinement cycle. The model learns your specific production environment. Your team learns the model's capabilities. Both sides adapt. That mutual adaptation creates the foundation for a successful deployment decision.
Week 4: Measure Impact and Decide on Production
Week 4 brings you to the decision point. You have completed the shadow run. You now compare your model's performance against manual inspection results. This comparison determines if the model is ready for production use. You make this choice using data, not instinct.
Evaluating Results Against Success Metrics
Start by revisiting the success criteria you defined in Week 1. These success criteria form your scorecard. Measure the model against each one.
Look at efficiency KPIs first. How much time did your model save on manual inspection? Did error rates drop? Your model's shadow run gives direct answers.
Next evaluate effectiveness KPIs. Check defect detection accuracy and false positive reduction. Research from Sandia National Laboratories shows the best human inspectors achieve only 80% peak detection. Your AI vision system should reach 97-99% accuracy. Compare your model's performance against these benchmarks. A model at 97% or higher matches proven production systems.
Track quality and business impact KPIs. First Pass Yield jumps from 85-92% to 96-99.5% using an AI system. Customer complaint rates drop 60-80%. Overall Equipment Effectiveness improves from roughly 68% to about 84%. Compare your pilot results against these figures. Does your model deliver similar gains?
Check throughput. Your model processes parts at consistent speed without fatigue. Human inspectors degrade after 20-30 minutes of continuous work. It holds accuracy all shift. This consistency drives production value.
Calculating ROI and Making the Go/No-Go Decision
Translate performance data into financial terms. Calculate the ROI of moving your model into full production use on your chosen line. Will the system work in your production environment? Is the system production-ready for this step?
Start with cost savings. Calculate scrap reduction. Count fewer defective parts reaching customers. Include lowered penalty fees and minimized warranty liabilities. These savings accumulate quickly.
Add time savings. Measure cycle time reduction per part. Multiply by daily volume. Multiply by operating days per year. This gives annual labor savings.
Your ROI estimate starts with these numbers. This ROI calculation gives you the number you need. Strong ROI justifies the move to full production use. Industry ROI figures provide your comparison point. Focus on the ROI number as your key metric.
Industry data shows typical first-year ROI between 200-400%. Median first-year ROI is 300%. Payback periods range from 6-18 months. High-volume automotive shows 4-8 month payback. Electronics assembly shows 6-10 months. Food and beverage shows 7-12 months. Pharmaceutical shows 8-14 months. High-mix metal fabrication shows 12-24 months. Some documented examples show ROI of 1,879% with payback in 1.8 months.
Compare your projected ROI against these benchmarks. Does your model deliver a convincing return? If yes, plan your production deployment. If no, document your findings.
A no-go decision is a valid outcome. Your 30-day pilot succeeded regardless. You learned where the approach falls short. You know what new training data you need. You know what additional training cycles remain. You can adjust and run another pilot. The integration goal was learning, not perfection.
Your success criteria guided every step. Measure against them honestly. Let the data decide. Your model has demonstrated value for production. This production data supports your decision. Moving into production requires confidence. A full-scale deployment needs solid evidence from your pilot. Your vision-based approach caught real defects during the run.
Common Pitfalls to Avoid in Your 30-Day Pilot
Avoiding the 'Model Accuracy' Trap
Your model reports 94% accuracy. That number feels good. It does not tell you if the pilot works. Accuracy measures technical correctness. Business impact measures real outcomes. These two metrics often diverge.
Consider the difference. A model can classify images correctly yet fail to reduce defect escape rates. It can flag every anomaly yet slow your line. Your CFO cares about reduced scrap and faster throughput. Your engineers care about precision and recall. Both matter. Only one drives your ROI.
Nearly 70% of initial industrial AI projects fail to leave "Pilot Purgatory." The root cause is rarely computing power. It is a data-resolution gap. Generic platforms monitor complex physics with polling rates that miss the transients indicating failure. Your pilot must avoid this trap.
Focus on business metrics instead. Track defect escape rate reduction. Measure inspection time per asset. Count avoided shutdowns. McKinsey Global Institute found that organizations defining business-outcome success criteria before starting AI pilots were 2.4 times more likely to scale successfully. Define those criteria in Week 1. Revisit them in Week 4.
A successful demo creates false confidence. Test conditions are cleaner than real manufacturing. Production introduces part shift, reflective surfaces, and new defect patterns. Technical proof on curated images is not operational proof under factory variability. Your shadow run reveals this gap. Trust that evidence.
Managing Change and Employee Buy-In
Your operators may see the AI vision system as a threat. They might fear replacement. You must show them this tool makes their work easier. Involve them from day one. Ask which defects frustrate them most. Let them label the training images. Their expertise shapes the model.
One food handling project failed completely when cucumbers appeared. This item never existed in the training data. The team rebuilt the dataset, re-annotated images, and retrained. That cost time and resources. Better upfront data planning would have prevented it. Your operators know what variations appear on your line. Ask them before you collect images.
Data quality matters more than quantity. Typical factory data is noisy and inconsistent. AI systems need accurate, relevant, properly annotated data. Your quality team provides that annotation. Their buy-in determines your data quality.
Resist scope creep. You might see other problems during the pilot. You might want to fix them all. Do not. Your single, focused problem from Week 1 remains your only target. Expanding scope mid-pilot invalidates your baseline. It delays your deployment decision.
Frame the system as a tool, not a replacement. Your model handles repetitive checks. Your inspectors handle judgment calls. This integration improves both. When your team understands this division, resistance fades. Adoption follows. Your production rollout becomes smoother. Your vision system earns its place on the line.
A successful ai pilot never depends on luck. It follows a disciplined process. You defined one problem in Week 1. You labeled images and completed training in Week 2. You shadow-ran your model against human inspectors in Week 3. You calculated roi and made your decision in Week 4. Each phase builds upon the last.
The 30-day pilot forces focus. You need no new hardware or data science team. Your vision system uses existing cameras. Your quality team provides the expertise. Your success criteria guide every choice.
Take the first step today. Whether you choose go or no-go, you learn. That learning informs your next ai implementation. Your production deployment will benefit from these insights. Your ai vision pilot prepares you for long-term success.
FAQ
Do I need new cameras for the ai vision pilot?
No. You already own the hardware. The process uses your existing cameras. Setup takes hours, not weeks. The blog shows you how to leverage your current equipment.
How many images do I need for training a reliable inspection model?
For most defect classes, you need 200 to 500 labeled examples. For anomaly detection, start with 100 to 200 good-part images. Data quality matters more than quantity.
Who should label the training images?
Your quality team should lead labeling. They know the difference between a true defect and a harmless variation. Their expertise prevents the model from learning the wrong patterns and prepares it for production conditions.
What if my model underperforms during the shadow run?
A no-go decision is valid. Your pilot still succeeded. You learned where the approach falls short. Document the gaps, gather more training data, and run another pilot.
How does this pilot prepare me for full production deployment?
The 30-day pilot proves your concept on one line. You collect real performance data. You calculate ROI. This evidence guides your production rollout and reduces risk for scaling.
See Also
How Artificial Intelligence Accelerates Product Launch Timelines
Using Machine Learning To Optimize Brand Production Capacity
Enterprise Strategies For Improving Manufacturing Predictions With AI
Do Your Intelligent Systems Monitor Social Platforms For Insights?