Closing the Loop Forecast to Buy Plan Guide
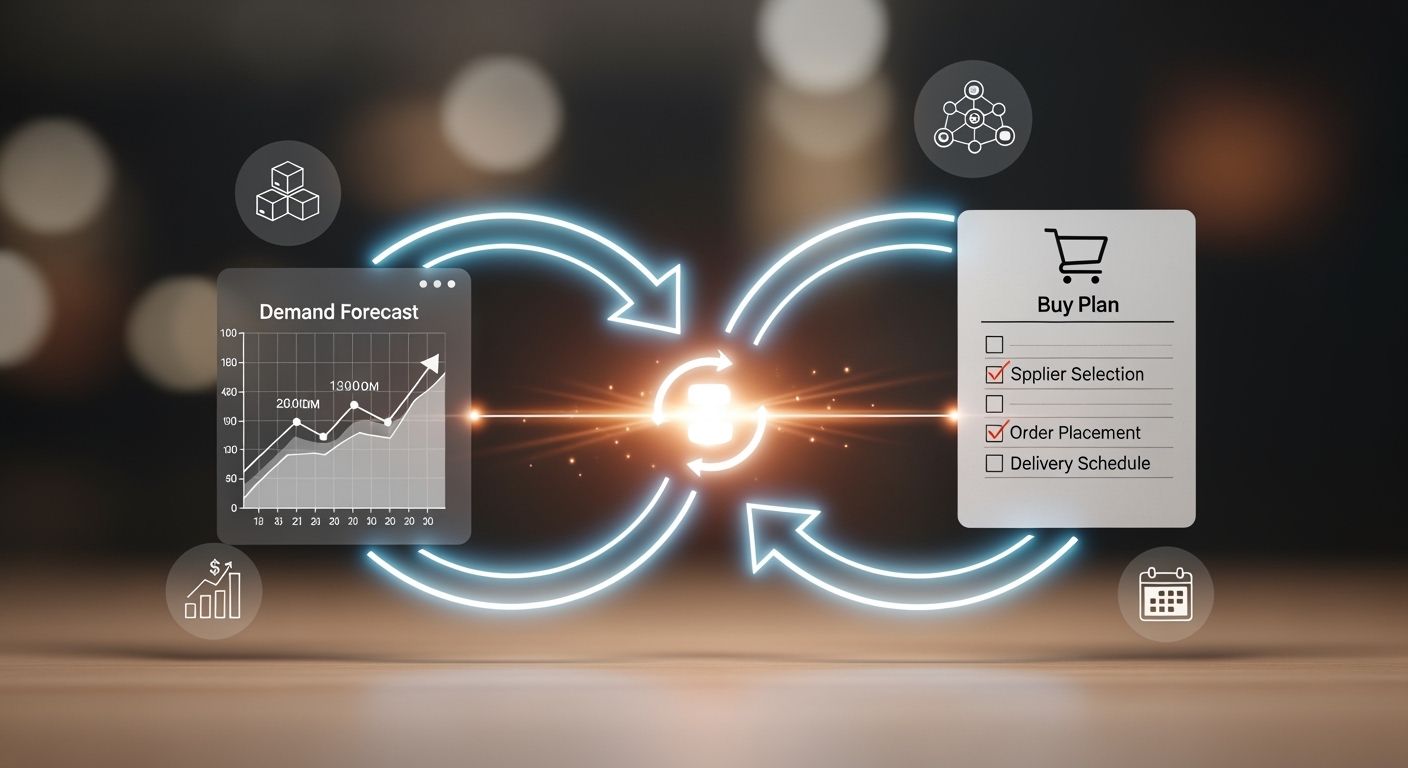
Supply chain managers often face a major operational disconnect. You predict future demand, but your purchasing team orders different quantities. By closing the loop between demand forecasting and procurement execution, you align your business strategy perfectly.
Strategic alignment directly protects your business bottom line!
This unified approach prevents costly stockouts and eliminates expensive overstock. You optimize working capital and maximize ROI across inventory investments. Most importantly, you bridge departmental gaps and transform raw customer demand into actionable purchase decisions.
Step 1: Evaluating Demand Forecasting Inputs
Solid buy plans depend on strong input data. You must analyze your base numbers before sending purchase requests to suppliers. 📊
Assessing Historical Accuracy and Bias
You need to measure baseline error across historical predictions. Tracking past performance highlights recurring operational gaps.
| Metric Name | Description / Formula | Control Threshold / Interpretation |
|---|---|---|
| Tracking Signal | Quantifies systemic forecast bias across periods. | Values beyond +4.5 or -4.5 over 12 periods indicate an out-of-control forecast. |
| Normalized Forecast Metric | Bounds bias values between -1 and 1. | Cumulative values > 2 show over-forecasting; values < -2 show under-forecasting. |
Key mathematical metrics offer distinct visibility:
- Mean Absolute Percentage Error (MAPE): Measures the percentage difference between predicted and actual demand.
- Mean Squared Error (MSE): Quantifies variance by squaring errors to measure overall accuracy.
Evaluating MAPE alongside cycle error helps you adjust future demand forecasting models.
Accounting for Seasonality and Promotions
Short-term sales spikes can easily distort long-term market trends. Confusing holiday promotions with core growth leads to overhiring or excess inventory. Separating seasonal dips from baseline figures improves your forecast accuracy by 42%.
Modern supply chain systems use advanced predictive capabilities to capture external events. You elevate overall performance by integrating event-driven demand directly into your workflows.
💡 Tip: Modern demand forecasting tools leverage ai algorithms to isolate temporary promotional spikes from actual underlying demand trends.
Establishing Baseline Lead Times
Supplier delays directly disrupt operational schedules. You must combine historical performance data with event-driven forecasting to predict arrival dates accurately.
- Track real-world events: Weather changes and shipping disruptions create sudden supply bottlenecks.
- Leverage ai technology: Smart software processes recent market events to refine delivery forecasts.
- Follow latest trends: Industry trends impact supplier raw material availability.
- Analyze event-driven demand: Market events shape immediate purchasing decisions.
- Measure operational impact: Delays heavily impact your total safety stock calculations.
Advanced forecast models capture event-driven demand variations effortlessly. Using real-time inputs ensures your baseline forecasts remain reliable during volatile market shifts.
Step 2: Translating Demand into Net Requirements

Planning failures rarely happen because you lack data. Disconnected choices between demand planners and procurement buyers cause most inventory problems. Raw predictions remain useless when buyers ignore current stock levels. You build a resilient supply chain by driving decision intelligence into your daily workflows. You turn statistical forecasts into precise purchasing instructions when you align your team goals.
Calculating On-Hand and On-Order Stock
You must link raw predictions to physical warehouse inventory. You can execute three core operational tactics to bridge statistical demand models with actual inventory levels:
- Implement Live Inventory Tracking Tools: Utilize specialized connectors like the Inventory Visibility Add-In within Dynamics 365 to establish a continuous, live link between on-shelf inventory and forecasting modules, preventing errors caused by batch updates.
- Consolidate Stock Metrics Across All Sites: Eradicate operational silos by establishing a unified view of inventory across every warehouse and fulfillment center, ensuring baseline forecasting and safety stock metrics rely on complete data.
- Incorporate Cross-Functional S&OP Insights: Adjust automated baseline forecasts by overlaying human intelligence from sales, marketing, and operations regarding promotions, market changes, and contractual shifts.
💡 Tip: Calculate your exact inventory position before you submit new order requests.
You measure your overall inventory position by subtracting existing customer backorders from physical stock and adding incoming items: Inventory Position = Inventory On Hand - Backorders + Inventory Currently On Order.
You can calculate your replenishment needs using simple math equations:
- Stock Level Calculation:
Stock Level = Stock-On-Hand + Stock-On-Order - Back-Orders - Net Stock Definition:
Net Stock = Stock-On-Hand + Stock-On-Order - Recommended Order Quantity:
Recommended Order = Order Up To - Net Stock
Setting Dynamic Safety Stock Levels
Static safety stock numbers quickly fail in volatile markets. Modern dynamic safety stock determination extends traditional statistical models through algorithmic systems and machine learning models, such as Multi-Echelon Inventory Optimization (MEIO). These systems process real-time variability data feeds to dynamically calibrate safety stock thresholds.
| Variable | Parameter Represented | Role in Dynamic Calculation |
|---|---|---|
| Z | Service level factor | Converts probability target (e.g., 95%) into a statistical multiplier |
| σd | Standard deviation of demand | Captures demand fluctuations relative to average demand |
| LT | Average lead time | Measures mean duration required for stock replenishment |
| D | Average daily demand | Represents baseline sales or consumption volume per day |
| σLT | Standard deviation of lead time | Quantifies lead time uncertainty and vendor delays |
| Formula | Z × √((σd² × LT) + (D² × σLT²)) | Integrates both demand and lead time variances into a dynamic safety stock level |
You calculate dynamic safety buffers using systematic steps:
- Service Level Factor (Z-Score): Denotes the targeted service level probability.
- Demand Variability Component: Utilizes the standard deviation of demand during the specified lead time.
- Calculation:
Safety Stock = Z-score × Standard Deviation of Demand During Lead Time.
Adjusting buffers dynamically helps you absorb customer volume swings without inflating overall holding costs.
Factoring Open Purchase Orders
Unmatched incoming orders create unnecessary double purchases. You must verify every open purchase order against your net replenishment requirements.
Net Requirement = (Baseline Demand + Dynamic Safety Stock) - Net Stock
You prevent expensive inventory build-up by linking open supplier shipments to future baseline sales forecasts. This step confirms purchase orders arrive right when your warehouse needs stock.
Step 3: Applying Supply Constraints
Unconstrained forecasts rarely match practical operational limits. You cannot simply send net replenishment figures directly to suppliers as actual purchase orders. Raw purchasing plans must pass through realistic operational guardrails. Working capital restrictions, operational budgets, and strict supplier conditions define your true buying power. You build executable buy plans when you balance real-world operational constraints against statistical replenishment needs.
Factoring Vendor Minimum Order Quantities
Suppliers impose Minimum Order Quantities (MOQs) and batch multiples to safeguard their production efficiency. These requirements force your team to balance inventory carrying costs against manufacturing batch limits. You must apply data-driven methods to balance these supplier parameters against inventory targets.
Many supply chain teams utilize a Dual-Sourcing Inventory Model to maintain stock stability under strict supplier rules:
- Supplier Constraint Balancing: You split replenishment orders between a cheaper regular source ($Q_R, s_R$) and a faster express source ($Q_E, s_E$) using historical operational lead time data ($L_1, L_2$) and real-time vendor availability.
- Demand Target Optimization: You incorporate statistical demand models ($D \sim \mathcal{N}(\mu, \sigma^2)$ during lead times) and safety stock ($SS$) thresholds to mitigate stockouts and lower lost sales probability.
- Data Inputs: You feed past sales records, market intelligence, seasonal dynamics, and historical lead times into your planning system to refine order triggers.
High MOQs on expensive items quickly tie up cash reserves. You can deploy targeted negotiation tactics to lower vendor thresholds across high-cost categories:
- Standardize Shared Components: You can specify identical components across distinct SKUs to satisfy vendor material thresholds without increasing finished goods inventory.
- Utilize Blanket Purchase Orders: You can commit to total annual purchase volumes through blanket orders while scheduling smaller release batches across the year.
- Offer Premium Unit Pricing: You can pay a slightly higher unit price for smaller order sizes to offset vendor setup costs.
| Strategy Category | Actionable Tactics |
|---|---|
| Financial Incentives | Offer upfront deposits, advance payments, or accelerated payment schedules in exchange for smaller batch requirements. |
| Scheduling Flexibility | Set up phased or staggered shipment schedules to meet total order commitments without holding excessive inventory. |
| Relationship & Forecasts | Share detailed baseline predictions, commit to ongoing regular orders, or propose incremental MOQ increases as the partnership grows. |
| Timing & Aggregation | Initiate negotiations during off-peak supplier seasons or aggregate orders across multiple product lines. |
You can also lower inventory exposure through specific purchasing arrangements:
- Accept Unit Price Adjustments: You absorb slightly higher per-unit costs to help manufacturers cover fixed setup expenses on smaller runs.
- Combine Similar Product Lines: You merge orders for items sharing raw materials to meet volume thresholds easily.
- Engage in Group Purchasing: You partner with non-competing businesses to place joint orders and share total volume requirements.
💡 Tip: Aligning supplier order multiples with verified consumption patterns stops warehouse saturation before goods leave the factory floor.
Adjusting for Lead Time Variability
Static lead time metrics create major blind spots for procurement operations. Vendor shipping delays quickly trigger operational disruptions across downstream channels. You need active buffers to protect your buy plans against vendor performance swings.
You can apply key operational techniques to buffer your purchasing schedule against lead time volatility:
- Dynamic Safety Stock Adjustments: Review safety stock levels daily to capture real-time supplier reliability shifts.
- Predictive Analytics & Inventory Planning: Employ specialized software to track and account for transit disruptions automatically.
- Order Frequency Optimization: Issue smaller replenishment orders regularly to minimize single-shipment exposure.
- Inventory Categorization: Apply the 80/20 rule to prioritize protective buffers for high-yield items.
- Supplier Diversification: Maintain secondary backup suppliers across alternate geographies to bypass sudden regional delays.
💡 Tip: Frequent order cadence reduces total inventory risk during volatile shipping cycles.
Aligning Orders with Cash Flow Limits
Working capital limits serve as critical guardrails for every purchasing strategy. Uncontrolled buy plans quickly deplete operational capital reserves. Procurement decisions must align directly with organizational budgets.
Available Buying Capacity = Approved Budget Limit - (Current On-Hand Commitment + Open PO Commitments)
You must integrate corporate finance rules into daily purchasing workflows:
- Collaborative Purchase Planning: You schedule order release dates alongside financial teams to match favorable cash flow windows.
- Internal Stock Transfers: You leverage multi-location visibility to move excess stock between facilities instead of issuing new purchase orders.
- Cross-Functional Training: You train procurement specialists and fp&a analysts to assess how purchase timing affects working capital.
- Adjusting Economic Order Quantity (EOQ): You transition to smaller order runs for high-value items to lower overall carrying costs.
Close collaboration with your internal fp&a group ensures purchasing schedules respect actual working capital boundaries. This structured alignment minimizes interest expenses while protecting baseline service targets. Unplanned bulk purchases create a major negative impact on corporate liquidity. Every procurement team must measure this financial impact prior to confirming large purchase orders.
Step 4: Finalizing the Operational Buy Plan
You turn verified replenishment numbers into actionable orders during this final phase. You bridge planning models and execution systems to secure your goods.
Converting Net Needs to Purchase Orders
You convert calculated net requirements directly into real purchase orders. Modern procurement platforms automate this transaction process to boost your baseline roi. 📦
Automation provides key operational benefits:
- Automated Verification: Software automatically flags missing vendor details and incorrect item pricing.
- Cross-Verification: Contextual logic cross-checks purchase data against pre-set business rules.
- Elimination of Manual Entry: Systems pull accurate quantities directly from inventory records.
- Process Standardization: Every transaction follows strict internal policies to prevent human error.
These automated steps create an immediate positive impact on your order accuracy.
Optimizing Container Loads and Freight
You maximize cargo space before sending final orders to suppliers. Smart loading algorithms reduce total ocean freight spending significantly. You prevent wasted container volume while protecting your operational budget.
| Category | Optimization Rule / Algorithm | Operational Impact |
|---|---|---|
| Technology | 3D Bin-Packing Algorithms | Calculates optimal product placement in seconds to maximize space. |
| Weight Distribution | Heavy Items First | Keeps center of gravity low and prevents floor damage. |
| Space Utilization | Vertical Maximization | Uses full container height and width to eliminate void space. |
Your fp&a team tracks shipping expenses to measure bottom-line impact across transit routes.
Aligning Procurement and Finance
You must secure approval from your finance department before issuing final orders. Close coordination protects corporate working capital.
| Approval Stage | Description & Function | Key Roles |
|---|---|---|
| Real-Time Budget Checks | System checks available funds automatically before order commitment. | Automated Systems |
| Departmental Validation | Ensures purchase orders match operational goals and allocated budgets. | Department Heads |
| Hierarchical Approval Chain | Executes authorization flows to confirm business necessity. | Managers & Finance Leaders |
You share current purchase schedules with fp&a analysts during weekly reviews. Your fp&a managers verify available funds to support uninterrupted operations.
Step 5: Closing the Loop Through Continuous Optimization

You achieve total operational control by continuously evaluating your inventory outcomes. You must compare early predictions against actual consumer purchases to refine your workflow.
Tracking Forecast vs. Actual Variance
You analyze past forecasts to uncover systemic variance across sales cycles. Market events frequently disrupt regular baseline sales. Unplanned market events alter baseline forecasts, so you must measure demand fluctuations quickly. Modern teams monitor consumer trends to separate brief spikes from long-term shifts. You evaluate the financial impact of sales variance to protect your working capital. Tracking event-driven demand highlights exact operational gaps across every inventory category. Accurate forecasts require continuous review of real-world buyer behavior.
Measuring Supplier On-Time In-Full Performance
Vendor performance directly influences your inventory health. You track On-Time In-Full (OTIF) metrics to evaluate order execution quality. Delivery delays create severe operational friction and trigger immediate stockouts.
| Industry Category | Acceptable / Target OTIF Rate |
|---|---|
| Automotive | 98% – 99% |
| FMCG / Retail | 95% – 97% |
| Industrial Goods | 90% – 95% |
| Construction | 90% – 95% |
| Overall Typical Benchmark | 95% – 98% |
Industry benchmarks clarify vendor delivery standards:
- Scores between 95% and 99% signal excellent operational performance and strong supply chain efficiency.
- Scores below 85% reveal major supply chain bottlenecks, vendor unreliability, or warehouse failures.
Monitoring these vendor trends helps you address supplier delays proactively. Vendor efficiency creates a positive operational impact across downstream fulfillment channels.
Feeding Execution Data into Future Cycles
You finalize closing the loop by returning operational results back into baseline models. Re-entering execution data establishes an automated, closed-loop system. Modern ai software evaluates forecast errors over time to enhance predictive precision.
- Dynamic Parameter Calibration: Systems replace static assumptions by constantly learning from actual fulfillment performance.
- Continuous System Adjustment: Automated software incorporates real-time sales events to capture sudden demand shifts.
This automated feedback process drives effective closing the loop for procurement teams. Modern demand forecasting tools integrate dynamic operational updates seamlessly. Your future forecasts become far more reliable as algorithms learn from actual sales behavior. Adjusted forecasts reflect real event-driven demand variations across all product lines. Reliable forecasts protect your business against expensive overstock risks.
You build a resilient supply chain by closing the loop between demand forecasting and purchasing execution. First, evaluate raw baseline numbers. Next, calculate net needs and apply real-world constraints. Continuous feedback connects actual sales, vendor performance, and future plans.
To align demand planning, procurement, and fp&a teams, you must foster cross-functional collaboration. Deploy modern software and track inventory turnover. You achieve a 300% to 500% roi within 18 months through these steps. Master closing the loop today to protect working capital while unlocking measurable roi across every cycle.
FAQ
How often should you update your buy plan?
You should review and update your buy plan weekly or monthly. Fast-moving product categories require frequent updates. Regular updates help you adjust orders based on actual sales and accurate inventory forecasts. This habit stops stockouts and protects your working capital.
What is the main difference between a demand forecast and a buy plan?
A demand forecast predicts unconstrained customer orders over time. A buy plan converts that prediction into actionable purchase orders. The buy plan applies operational constraints like supplier MOQs, current inventory levels, and available financial budgets to raw customer predictions.
How do you handle supplier minimum order quantities without overstocking?
You can negotiate lower MOQs by offering blanket purchase orders. Combine orders across products that share common raw materials. Alternatively, utilize dynamic inventory models to balance order frequencies against vendor minimums while protecting your cash flow.
Why does dynamic safety stock work better than static safety stock?
Static buffers ignore changing lead times and sudden market demand shifts. Dynamic safety stock adjusts automatically using real-time vendor performance and updated sales forecasts. You hold ideal inventory buffers while reducing total holding costs across every facility.
See Also
How To Build Long Lasting B2B Order Fulfillment Strategies
Five Live Strategy Options For Accurately Forecasting Customer Demand
Enterprise Best Practices For Improving Production Forecasting Using Artificial Intelligence
Smart Artificial Intelligence Capacity Planning Methods For Growing Modern Brands
Effective Dynamic Pricing Strategies Powered By Modern Artificial Intelligence Technology