How AI Inspection Cuts Defect Escape Rate
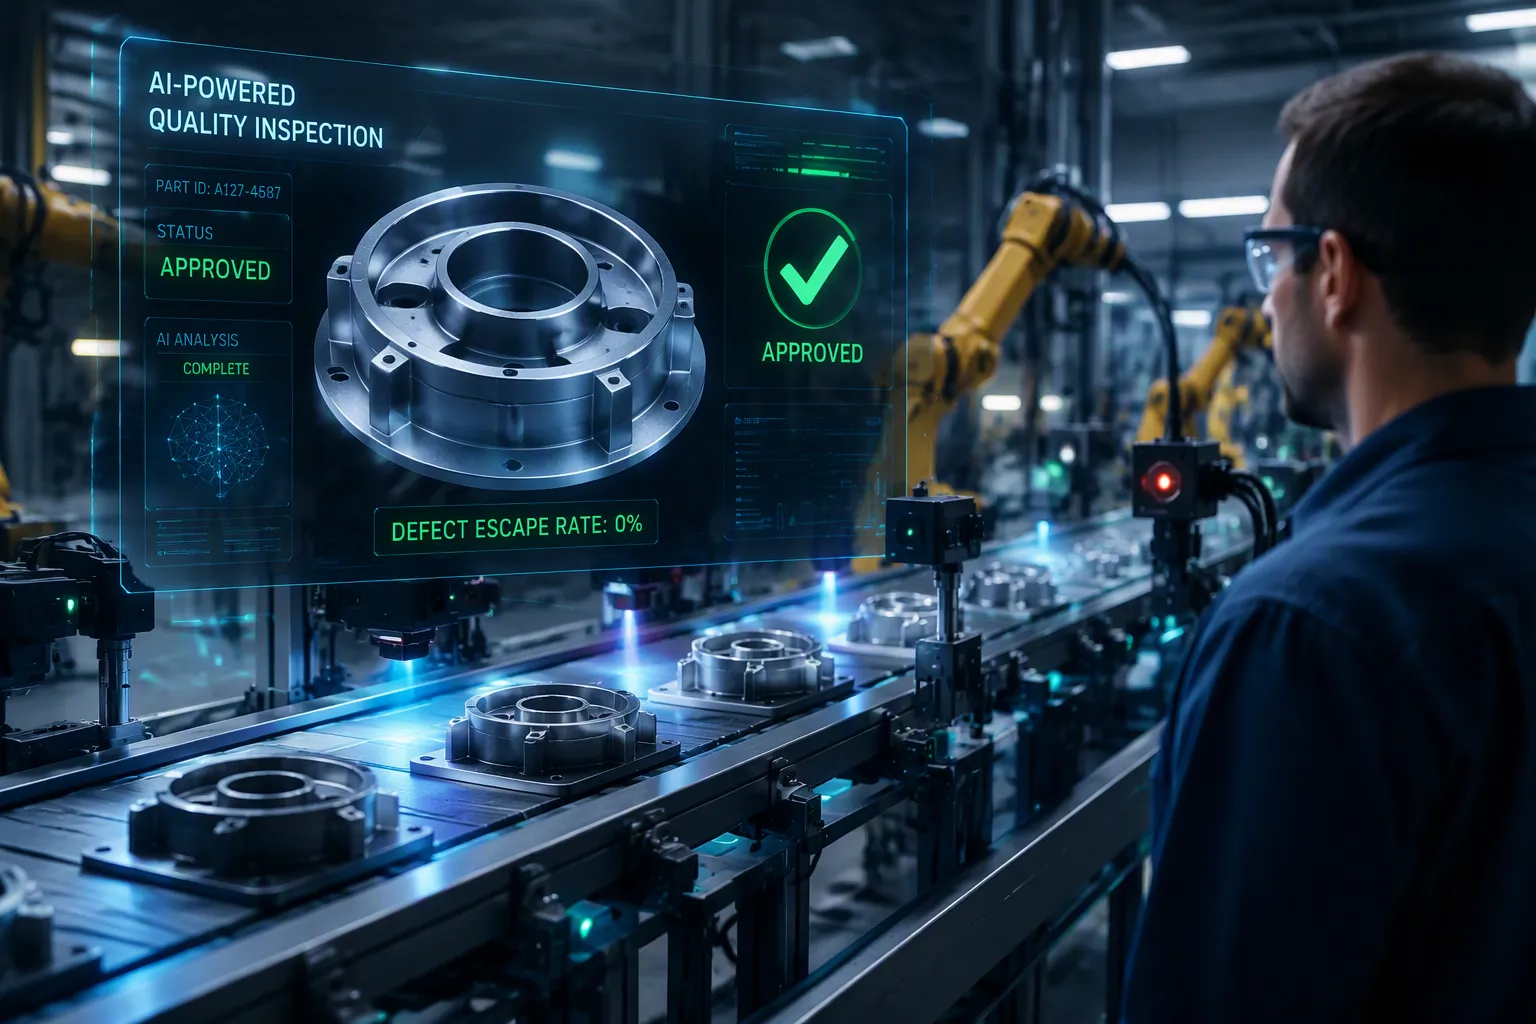
Picture this: your batch clears final inspection, but a defect escapes. A key customer discovers it later. This defect discovery triggers a costly recall and damages trust. Defect escape rate (DER) measures the percentage of defective units that slip through. This metric directly impacts your profitability and brand reputation. Yet many manufacturers overlook it. AI inspection offers a real solution. It transforms testing and quality assurance, not just improves it. This article explains how it systematically reduces defect escape rate. Understanding defect escape rate is key. It covers defect discovery, escaped defects, and product issues. You'll learn about validation and feedback loops to address process issues. Identify issues quickly. Escaped defects become rare. Defects no longer reach customers. Defects are caught early. The result is higher quality and fewer defects.
What Is Defect Escape Rate?
Defining the Metric and Its Importance
Defect escape rate measures the percentage of defective units that slip through your inspection. You calculate it with a simple formula. Divide the number of defective units shipped by the total units inspected. Multiply by 100. For example, your team inspects 10,000 units. You ship 50 defective ones. Your defect escape rate equals 0.5%. This metric tells you how many issues your inspection process misses.
Why does this number matter? A high defect escape rate means customers receive faulty products. Each escaped defect erodes trust. It increases support burden. Resources shift to firefighting. The table below shows how it differs from defect removal efficiency.
| Metric | What It Measures | Best Used For |
|---|---|---|
| Defect Escape Rate | Percentage of defects found after release | Understanding customer impact and quality gaps |
| Defect Removal Efficiency (DRE) | Percentage of defects found before release | Evaluating internal testing effectiveness |
DRE focuses on how well you catch issues internally. Defect escape rate tracks what happens after release. Both metrics matter, but DER directly impacts your customers.
Several factors make this metric a critical indicator for manufacturing quality. It quantifies the quality of releases. It measures how many defects reach production. It indicates if your team moves too fast without sufficient validation. A high defect escape rate suggests gaps in testing. It provides a constant feedback loop. It guides where to focus improvement efforts.
How Defect Escape Rate Measures Process Health
A low rate signals strong process control. A high rate reveals weaknesses. The relationship between Cpk and defect escape rate confirms this connection. As Cpk increases, the expected defect rate drops dramatically.
| Cpk Value | Corresponding Defect Rate (DPMO) |
|---|---|
| 1.00 | ~2,700 DPMO |
| 1.33 | ~63 DPMO |
| 1.67 | ~0.6 DPMO |
| 2.00 | ~3.4 DPMO |
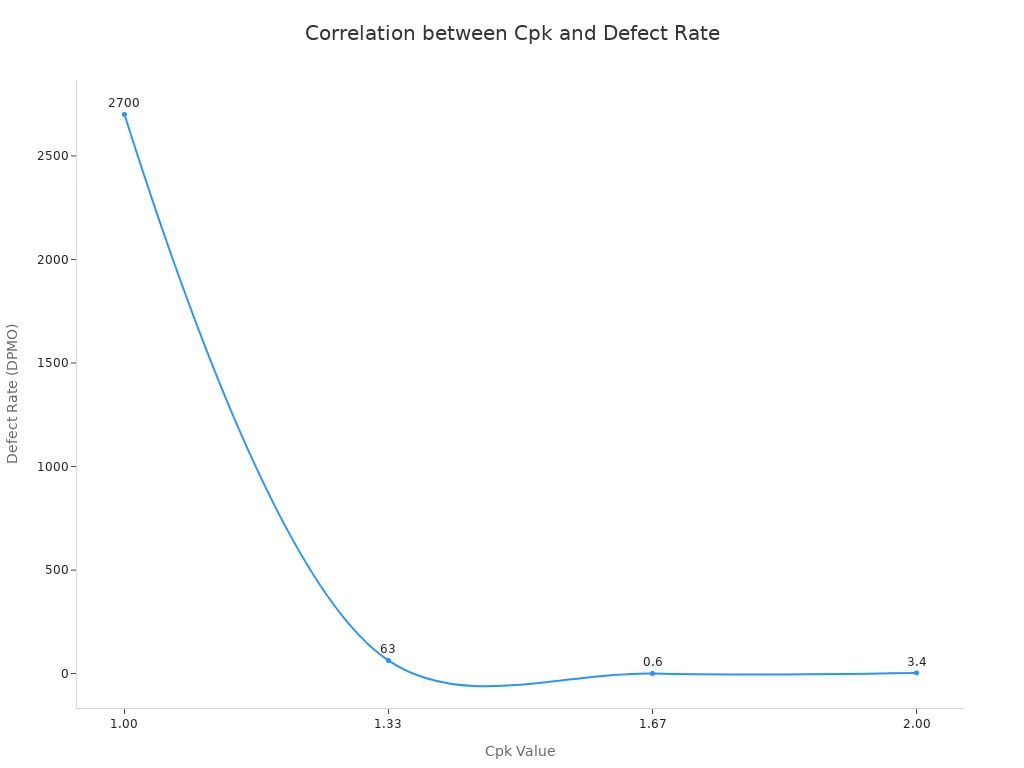
This inverse correlation is rooted in the Cpk formula. As Cpk increases, more breathing room exists between the process mean and the specification limit. The tail of the normal distribution shrinks. The parts-per-million defect rate drops proportionally. Higher Cpk values mathematically force a lower probability of defects escaping.
A lower rate directly correlates with higher customer satisfaction. Each cause creates cascading effects. High escape rates erode user trust. Escaped defects connect to on-time delivery rates. Monitor defect density and support ticket volume alongside defect escape rate. This gives you the full picture.
Lower DER also means lower warranty costs. Fewer defective units reach customers. You avoid costly recalls and rework. Your validation process becomes more effective. Your quality metrics improve across the board. The feedback loop helps you identify root causes faster. You address issues before they multiply.
Focus on reducing your defect escape rate. Start by measuring it accurately. Use the data to improve your process.
The True Cost of Escaped Defects
Financial Repercussions: Recalls, Rework, and Warranty Claims
Your defect escape rate directly predicts your financial exposure. When defects slip through, the costs escalate dramatically at each stage of detection. A defect caught during welding costs only a single re-pass to correct. That same defect discovered at final assembly costs 15 to 25 times more, requiring disassembly, repair, and re-testing. If that defect reaches the field, the cost multiplies to 50 to 100 times the baseline, covering warranty claims, logistics, and liability.
Consider the scale of these losses. A high-speed production line running 50,000 units per shift with a 10% scrap rate discards 5,000 units every single day. The loss extends beyond raw materials to include the energy, machine time, and labor already invested in those rejected batches. Reworking off-spec product takes twice as much effort as making it right the first time, directly stealing capacity from planned production runs.
According to the U.S. Food and Drug Administration, a single product recall can cost global companies approximately $10 million. This figure covers retrieval, disposal, and legal expenses. Newer reports show the range can reach $72.7 million depending on company size and product type. Your defect escape rate determines whether you face these costs.
Quality Systems Manager Dinesh Vora explains the hidden reality: "Plants that pull twelve months of scrap postings, rework hours, and warranty reserves into one sheet are usually shocked at how much bigger the real number is than what they had been reporting internally." Your defect escape rate hides these expenses across departments.
Operational and Reputational Damage: The Hidden Impact
Escaped defects force your team into constant defect containment mode. Engineering staff abandon improvement projects to investigate batch failures. Every hour spent diagnosing problems reduces time for process design and cost reduction. Your quality failures consume your innovation capacity. Competitors who prioritize quality leap ahead while your team remains stuck rectifying issues.
The reputational damage cuts even deeper. Consumer research shows that when a recall causes illness, 18% of customers permanently abandon the brand. Another 43% leave for several months before considering a return. Your defect escape rate directly influences these reactions. Each escaped defect raises doubts about your competence and integrity. Rebuilding that trust becomes an uphill battle.
Your validation process and feedback loops must catch defects early. Defect discovery at the source prevents downstream catastrophe. When you identify issues quickly, you avoid the cascading costs of field failures. Your defect escape rate drops. Your team returns to innovation. Your brand reputation strengthens. The choice is clear: invest in catching defects now, or pay far more later.
Why Defects Escape Traditional Inspection
The Limits of Human Visual Inspection
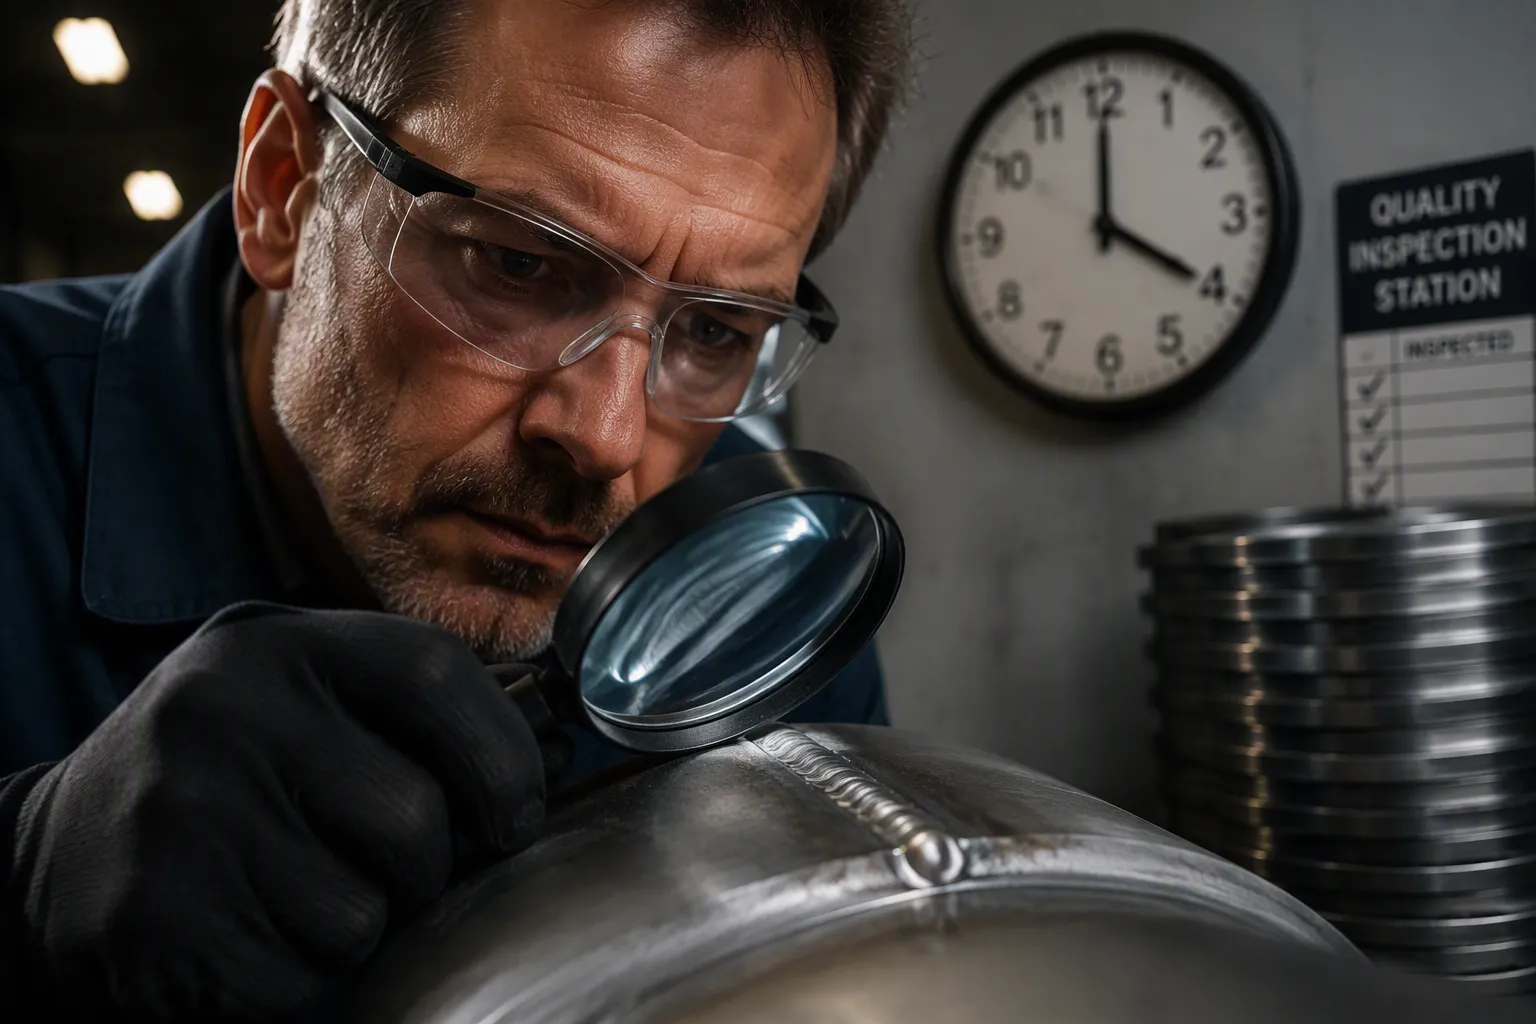
Your quality team works hard. They stare at products for hours. They check every detail. Yet defects still slip through. The problem starts with human biology. Your inspectors face real physical limits that no amount of training can overcome.
Fatigue affects detection accuracy across a shift. The same inspector catches a defect at 8am but misses it at 4pm. Repetitive visual tasks wear down concentration. Your most careful team member becomes less reliable as the day progresses. This pattern repeats daily, creating predictable gaps in your defect escape rate.
Inspector-to-inspector inconsistency creates another layer of risk. Two experienced inspectors can reasonably disagree on a borderline call near an acceptance threshold. One accepts a part. The other rejects it. Neither is wrong. Your quality outcomes depend on who happens to be working that day. This subjectivity makes your defect escape rate unstable and unpredictable.
Physical access limitations compound these challenges. Joints in confined spaces or tight assemblies resist direct viewing. Your inspector cannot see the full surface clearly. Confidence in visual calls drops. Some defects remain hidden by geometry alone.
Subsurface defects stay completely invisible to the naked eye. Lack of fusion forms beneath the surface. No amount of staring reveals it. On multi-pass welds, a discontinuity in an early layer gets covered by the next pass. The evidence gets buried before inspection occurs. Your inspector never had a chance.
The statistics confirm these limitations. Visual inspection alone reliably detects only 60% of weld defects. A 40% gap remains. These escaped defects travel through your process. They reach your customers. They inflate your defect escape rate. Human effort cannot close this gap. Your team needs a different approach.
Process Gaps and Data Blind Spots in Manual Systems
Manual inspection processes create another set of problems. Paper-based systems dominate many factories. Your inspectors record results on clipboards. They submit forms at shift end. Someone enters data into spreadsheets later. This workflow hides critical information from you.
Data silos form naturally in this environment. Each line maintains its own records. Each shift tracks its own results. Each product type has separate documentation. You cannot see the full picture. Defect tracking becomes impossible across these boundaries. You cannot answer basic questions. Which line produces the most escaped defects? Which shift struggles with specific issues? Which product type needs better validation? The data exists somewhere, but you cannot access it in a useful form.
This blindness prevents targeted improvements. You know defects escape. You cannot identify where or why. Your defect containment efforts become guesswork. You apply the same response to every problem. Some issues get addressed. Others persist unnoticed. Your defect escape rate stays high because you cannot see the patterns.
The feedback loop breaks down completely. Without reliable data, you cannot measure the impact of changes. You implement a new inspection step. Did it reduce escaped defects? You cannot tell. Your quality improvements become shots in the dark. Each change might help or hurt. The data cannot guide you.
Manual systems also delay information. A defect discovered on Monday might not appear in your reports until Friday. By then, thousands more units have passed through the same process. The same defect repeats. Your response always arrives late. You fight yesterday's problems while today's defects escape.
Your defect tracking needs real-time visibility. You need to know which line, which shift, and which operator produced each defect. You need immediate alerts when patterns emerge. Paper systems cannot deliver this speed. Your defect escape rate will keep climbing until you close these data gaps.
How AI Inspection Reduces Defect Escape Rate
The Power of Computer Vision and Machine Learning
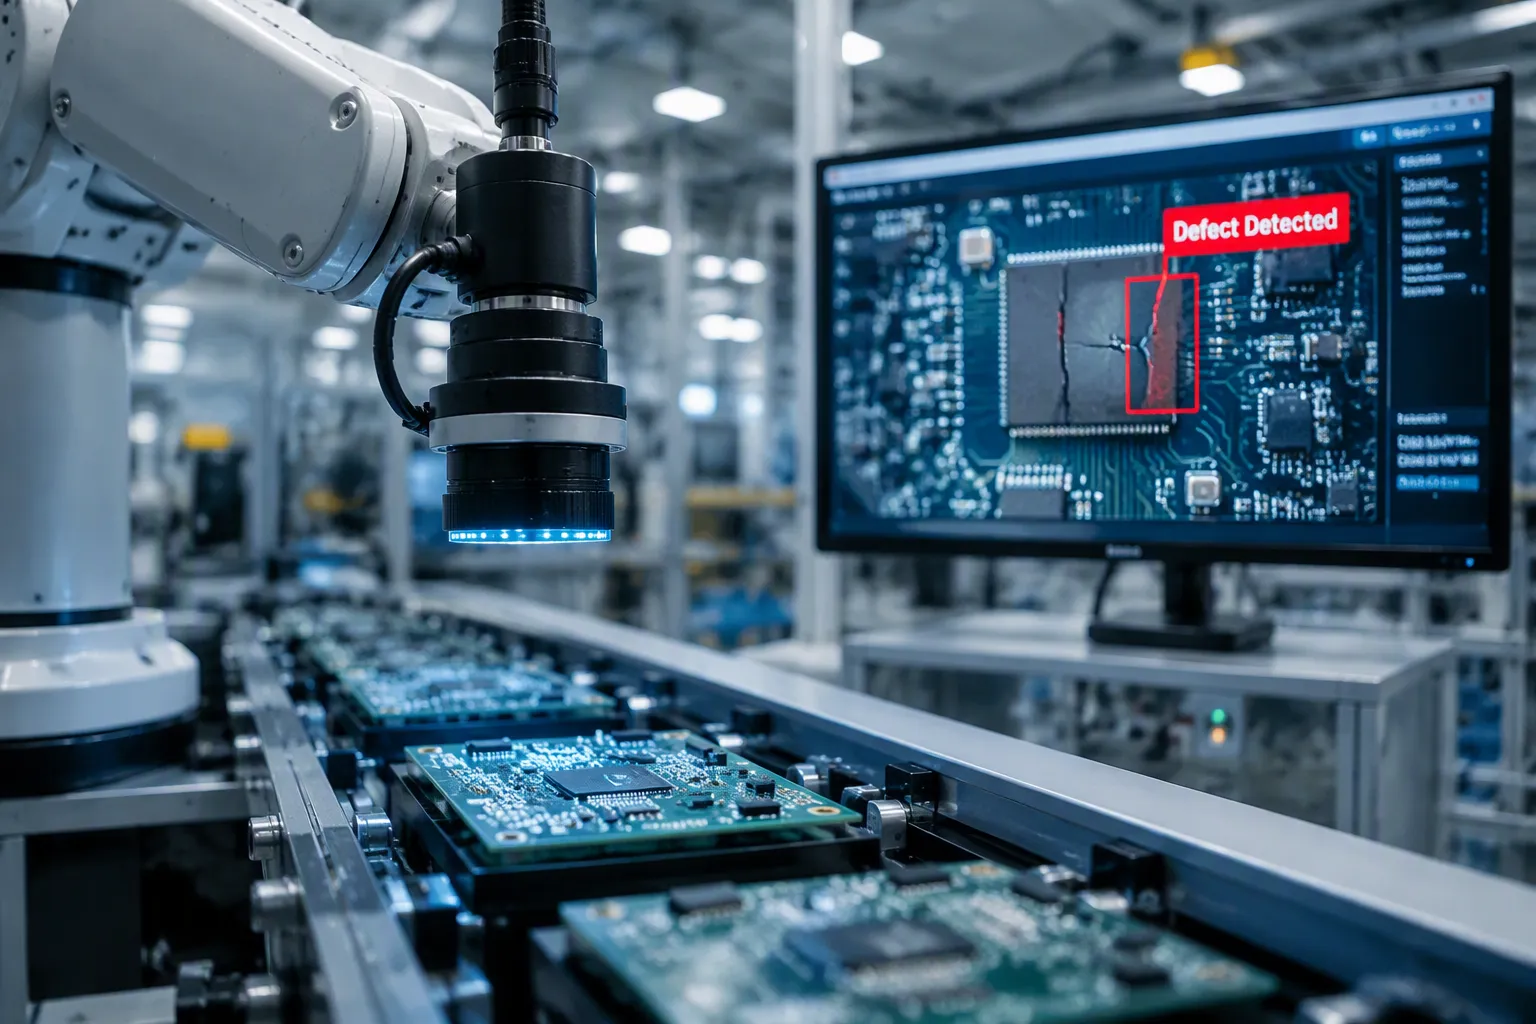
You now understand why issues escape traditional inspection. The limits of human vision and manual data systems create gaps. AI inspection closes these gaps with technology that sees what people cannot. Your defect escape rate drops because the system never gets tired. Escaped defects become a rare event.
Computer vision systems use high-resolution cameras and deep learning algorithms to inspect every product. These systems detect microscopic defects that the human eye misses completely. The list of detectable flaws includes:
- Hairline cracks: thin fracture lines that propagate under stress
- Pinholes and voids: tiny gaps in coatings or seals
- Inclusions and particulate: foreign material embedded in surfaces
- Surface texture anomalies: subtle roughness or finish inconsistencies
Your team also misses scratches, cracks, dents, corrosion, discoloration, porosity, contamination, and coating inconsistencies. AI systems catch all of these defects at production speed. These defects remain invisible to human inspectors. Each defect gets flagged immediately.
Machine learning makes these systems smarter over time.
Manufacturing data never stops changing. New defect patterns pop up, processes get tweaked, and your model accuracy tanks without warning. You end up constantly writing scripts to preprocess data, retrain models, and push updates.
AI inspection systems adapt automatically. They learn from new data and improve classification accuracy continuously. This learning loop tightens your feedback for quality improvement. New defects appear as processes get tweaked.
Three warning signs tell you when retraining is needed:
- Rising False Positive Rate: Good parts increasingly flagged as defective usually means lighting or material appearance has drifted from what the model was trained on.
- New Defect Types Appearing: A process or material change introducing a defect mode the model has never seen produces inconsistent or low-confidence classifications on those specific parts.
- Confidence Scores Trending Down: Even correct classifications made with declining confidence over time is an early warning sign worth investigating before accuracy visibly drops.
The key advantage of AI inspection is its ability to reduce false rejections while maintaining a low false acceptance rate. This balance optimizes costs and prevents defects from escaping. You avoid scrapping good products. You also catch bad ones before they ship. Deloitte reports that AI can achieve up to 90% accuracy in defect detection. AI also automates failure classification. It identifies root causes faster than manual analysis. Your feedback loop tightens. Your validation process improves. Escaped defects decrease further.
Proven Results and a Roadmap for Implementation
Reducing your defect escape rate requires more than buying a camera. You need a structured approach. Start with a pilot project on a critical production line. Choose the line with the highest defect escape rate. The impact will be immediate and measurable. This approach helps you identify issues quickly.
Next, integrate the AI system with your existing MES and ERP systems. Follow these key integration steps:
- Business goals identification. Define what you want to achieve. Lower defect escape rate? Faster root cause analysis? Both goals drive the same outcome.
- Legacy infrastructure assessment. Map how data moves from production lines to quality reports. Identify formats and protocols like OPC-UA or MQTT.
- Integration architecture development. Build the event capture, routing, and delivery layers. The AI vision system publishes a structured detection event with defect type, location, severity, confidence score, product ID, and timestamp.
- Data mapping and transformation implementation. Transform events into the format each target system requires. Connect detection events to work orders, shifts, and equipment via OPC-UA or REST API.
- Testing and optimization. Test in real-world conditions. Monitor performance under challenging conditions. Check false positive and negative rates. Track defect detection accuracy and system uptime. Address issues before they multiply.
Manage change by focusing on how AI augments the inspector role. Your team gains a powerful tool. They shift from tedious visual checks to higher-value analysis. The system handles repetitive inspection. Your inspectors focus on root cause investigation and process improvement. Your testing and quality assurance becomes more effective. Your defect containment improves. Your defect escape rate falls further. Quality strengthens. Customer trust grows. Issues get caught early. Escaped defects become a memory. Your validation feedback loop drives continuous improvement. Your defect escape rate reaches its lowest level. Fewer defects reach customers. You resolve issues faster.
Your defect escape rate reveals how many defective products reach customers. High rates drain profits through recalls and rework. Human error and data gaps cause these escapes. AI inspection offers consistency, continuous learning, and high accuracy. It catches defects humans miss. It provides real-time feedback for validation improvements.
Reducing your defect escape rate builds a resilient brand. Customers trust your testing and quality assurance. Escaped defects become rare events. Quality issues get resolved quickly. Your assurance program strengthens daily.
Take action now. Audit your current defect escape rate. Request an AI inspection demo. Consult experts about a pilot program. AI adoption is a strategic imperative for manufacturers serious about quality. Your customers deserve better. Your bottom line demands it.
FAQ
What makes AI inspection superior to human inspection?
AI systems never tire. They catch microscopic defects humans miss. They identify issues humans overlook. Machine learning improves accuracy over time. This consistency lowers your defect escape rate.
How quickly does AI inspection impact your defect escape rate?
Results appear immediately on your pilot line. The system catches defects from day one. Continuous learning improves detection further. Your validation process strengthens with each cycle. Your defect escape rate drops fast.
Will AI replace your human inspectors?
No. AI augments their role. Your team shifts from repetitive checks to root cause analysis. They investigate issues and fix defects. This collaboration makes your quality program stronger.
How do you implement AI inspection in your factory?
Start with a pilot on your highest-defect line. Integrate with your MES and ERP. Monitor results. The feedback loop guides continuous improvement. Your defect escape rate decreases steadily.
See Also
How Artificial Intelligence Accelerates Product Delivery Speed
Forecasting Textile Machine Failures With AI In 2025
Why Warehouse Audits Are Essential For Operational Efficiency
Next Generation Shipment Visibility Through EDI Tracking Advances