Why Integrate Visual Inspection Data? Surprising Benefits
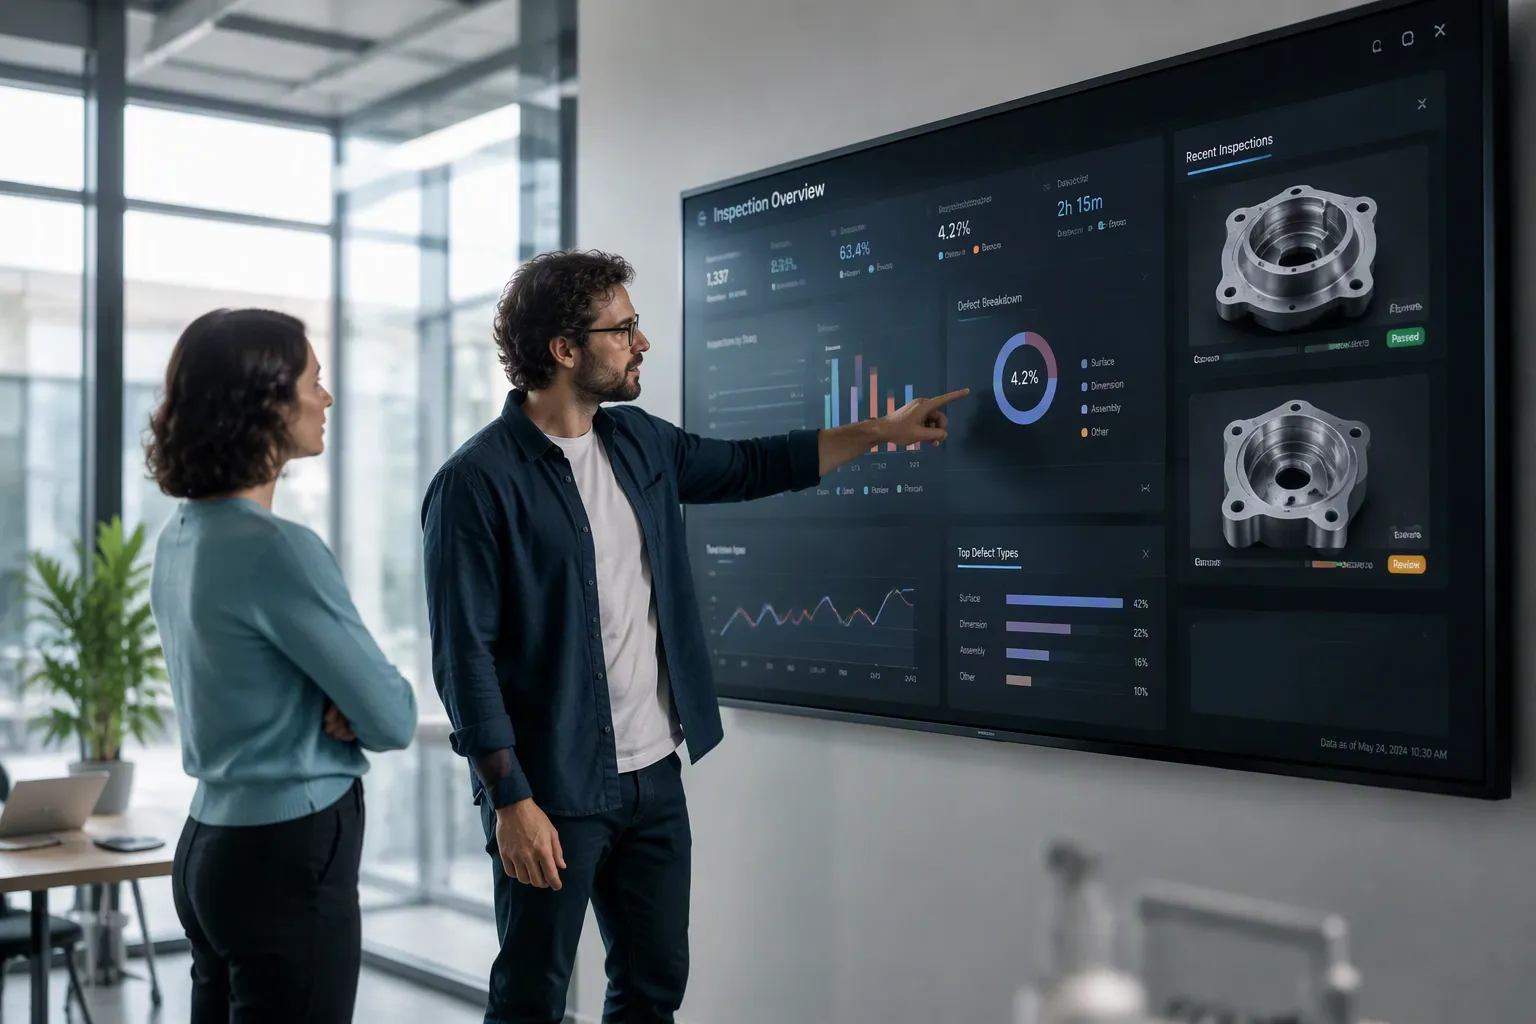
Your quality team logs inspection results in isolated spreadsheets or paper forms. These records rarely connect to your ERP. You lose visibility into production health. Why should you invest in integrating visual inspection data into your enterprise system? This integration transforms quality from a reactive cost center into a proactive strategic asset.
You gain real-time visibility, reduce operational waste, and build competitive differentiation. The benefits extend beyond simple defect detection. You enable automated workflows that flag issues instantly. This system creates a single source of truth for every part. Your inspection process becomes smarter with each cycle. Automated detection catches defects before they escalate. The journey requires practical steps like API integration and workflow design. You will discover both obvious and surprising advantages from integrating visual inspection data into your digital ecosystem.
Benefits of Integrating Visual Inspection Data
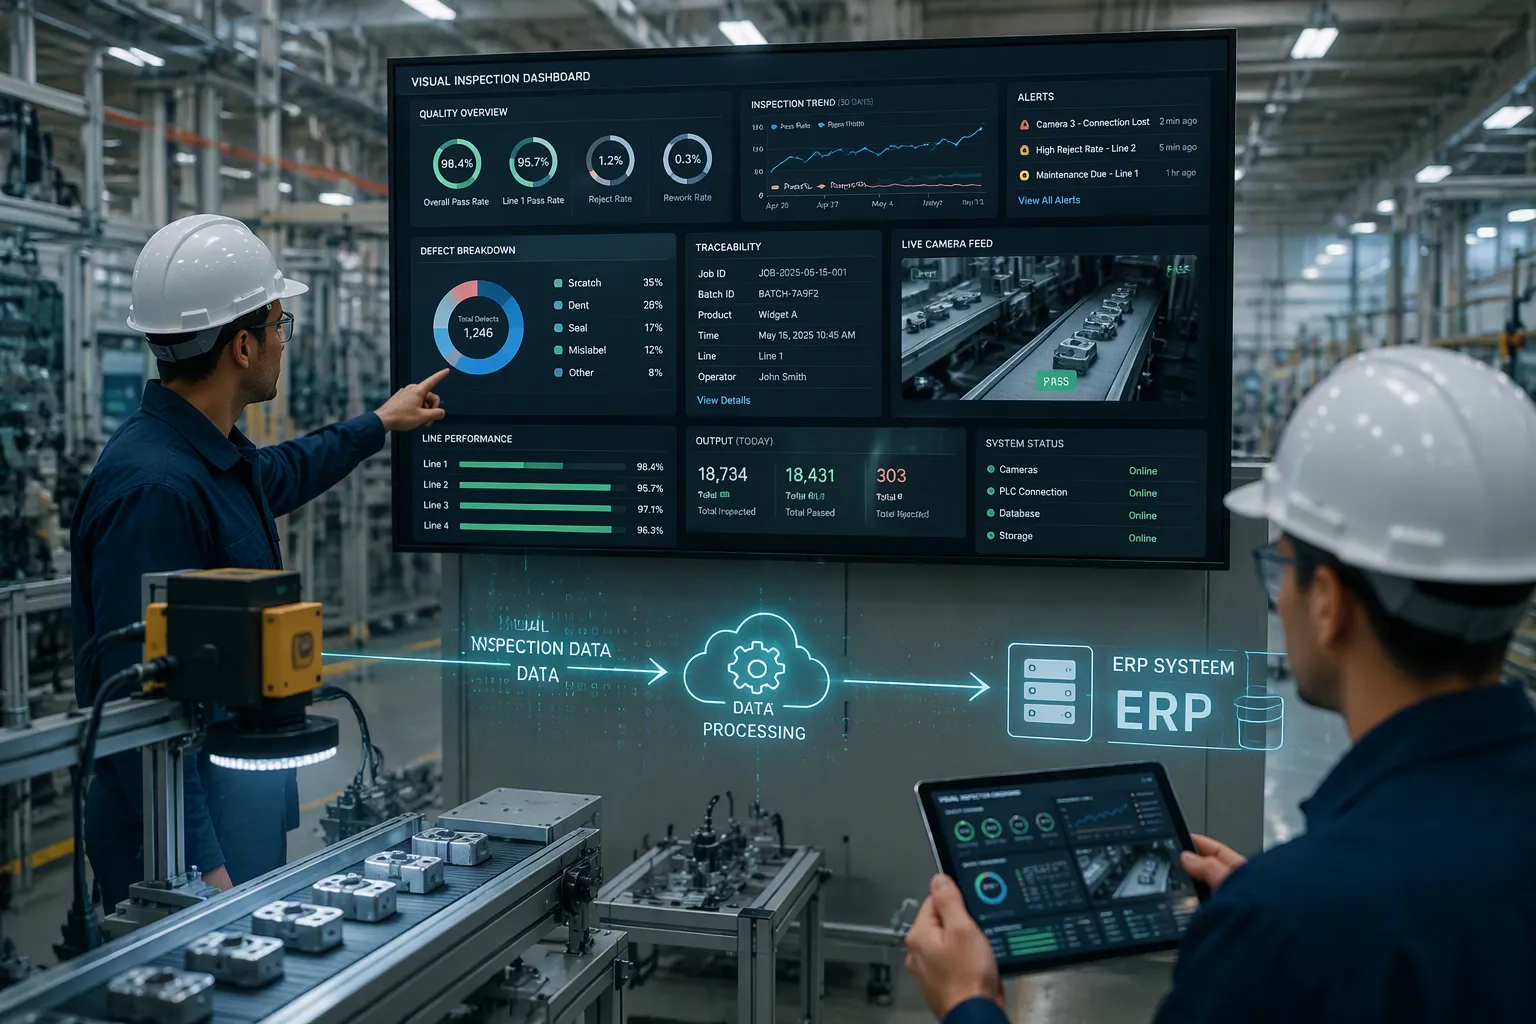
The power of integrating visual inspection data into your ERP goes beyond simple reporting. This system transforms how you see your factory floor. Every camera and sensor feeds into a single system. You gain complete visibility. Product quality improves. Let us examine the two primary benefits.
Real-Time Visibility and Traceability
API-based integration with existing systems like SAP or Oracle automates the flow of information. Work orders and defects move between systems without manual entry. The bidirectional flow ensures data consistency across systems. Your ERP pushes production data to the inspection software. The software sends results back. This creates one source of truth.
The numbers confirm the value. Facilities using API integration achieve a 99% inspection compliance rate. Paper systems reach only 67%. Response time to quality defects drops to 15 minutes. Without integration, the delay stretches to six hours. Inspection speed increases by 90%. Manual entry drops to zero. Timestamps record every result. One facility saved $47,000 per year in fines.
Real-time visibility puts traceability data in context. You compile cycle times, operator IDs, and barcode scans into dashboards. You see exactly which parts were installed. You track changes through redlines. Non-conformances appear instantly. This depth of traceability improves quality.
Digital traceability narrows recall scope significantly. One case reduced the recall from 14,000 cases to 2,100 cases. That is a 60-80% reduction. The savings exceeded $6M.
Immediate access to trace data accelerates corrective action speed, enabling faster response to quality issues and strengthening manufacturing traceability.
Proactive Quality Control
Reactive quality finds defects after they happen. Proactive quality prevents defects from appearing. Your approach shifts from correcting problems to preventing them.
| Aspect | Reactive Quality | Proactive Quality |
|---|---|---|
| Focus | Detecting and correcting defects after they occur | Preventing defects |
| Timing | Responds after problems | Prevents problems |
| Approach | Corrective (inspect, rework, repair) | Preventative (design, planning, process control) |
| Examples | Quality control inspections, rework | Design for manufacturability, SPC |
The fusion of automated visual inspection with IIoT makes proactive quality possible. An ai vision system detects defects on your line. It catalogs patterns. It records time and frequency. You identify root causes immediately.
In medical device manufacturing, detection prevents dangerous flaws. In food production, flagging mislabeled packaging helps meet standards. In transportation, automated detection removes defective parts instantly. The automated NCR generation process documents each issue. It updates your quality management system automatically.
The results show clear value. Closed-loop analysis reduces warranty spend by up to 40%. Systematic classification cuts recurrence rates by over 60%. A Deloitte report shows a 10-20% decrease in quality costs. Proactive strategies yield a 15-30% reduction in inventory. The Manufacturing Institute reports a 25% reduction in downtime.
The fusion of Automated Visual Inspection (AVI) with the Industrial Internet of Things (IIoT) and Big Data is a transformative development. This integration facilitates real-time analysis, which directly supports proactive decision-making in quality control.
By leveraging historical data, your automated systems forecast potential defects. You schedule maintenance before failures. This integration creates a closed loop. Your visual inspection solutions become smarter. You maintain high accuracy with each cycle. Your production data feeds back for continuous improvement. Automated systems learn from every detection event. The system integration you build today compounds its value over time.
Integration Impact on Cost and Waste
The financial case for integrating visual inspection data extends far beyond quality metrics. You see direct savings in materials, labor, and inventory. Every defect you catch early costs less than one you find later. The integration creates feedback loops that stop waste before it compounds.
Minimizing Scrap and Rework
Defect detection at the source changes your cost structure dramatically. A defect caught at the inspection station costs you about $1. That same defect discovered by your customer costs between $100 and $1,000. A recalled product from the field can cost $10,000 or more. Late detection adds 10 to 15 times the rework cost compared to catching the issue at its origin. Automated visual inspection at the first station eliminates downstream contamination entirely.
The system alerts operators immediately when a defect appears. Sorting begins automatically. Defective products never move forward in your process. This real-time response reduces rework and avoids downtime. Your production data shows exactly where problems occur. You maintain high productivity without sacrificing quality.
The financial returns follow quickly. Most manufacturers see a return on investment within 12 to 24 months. Some high-volume lines achieve payback in just 5 to 8 months. One steel production case reported an ROI exceeding 1900% in a single year. Accuracy improved from roughly 70% to 98%. Annual savings reached $2 million. A mid-size automotive Tier 1 supplier invested $450,000 and realized $767,000 in annual returns, achieving payback in about 7 months.
Optimizing Inventory and Supply Chain
Integration with your ERP transforms how you manage parts and materials. When your ai vision system flags a defect, the system updates inventory automatically. Bad parts never enter your stock. Correct parts get reserved against specific work orders. Mechanics scan each part at installation. The system verifies the match and deducts inventory only at that moment.
This automated ncr generation creates a complete record. You trace every part from purchasing through inspection to sales. Returns management becomes simpler. Health and safety compliance improves. You respond to recalls quickly because you know exactly which parts went where.
Real-time production tracking integrates quality control checks throughout manufacturing. You catch issues early in the process. Inspection plans based on product specifications identify defects in raw materials at critical stages. You review supplier specifications and test samples. Your supply chain performs better because quality data flows freely. This system integration creates a closed loop where every detection event improves your next decision.
Data-Driven Decisions and Competitive Advantage
Automated Visual Inspection for Predictive Insights
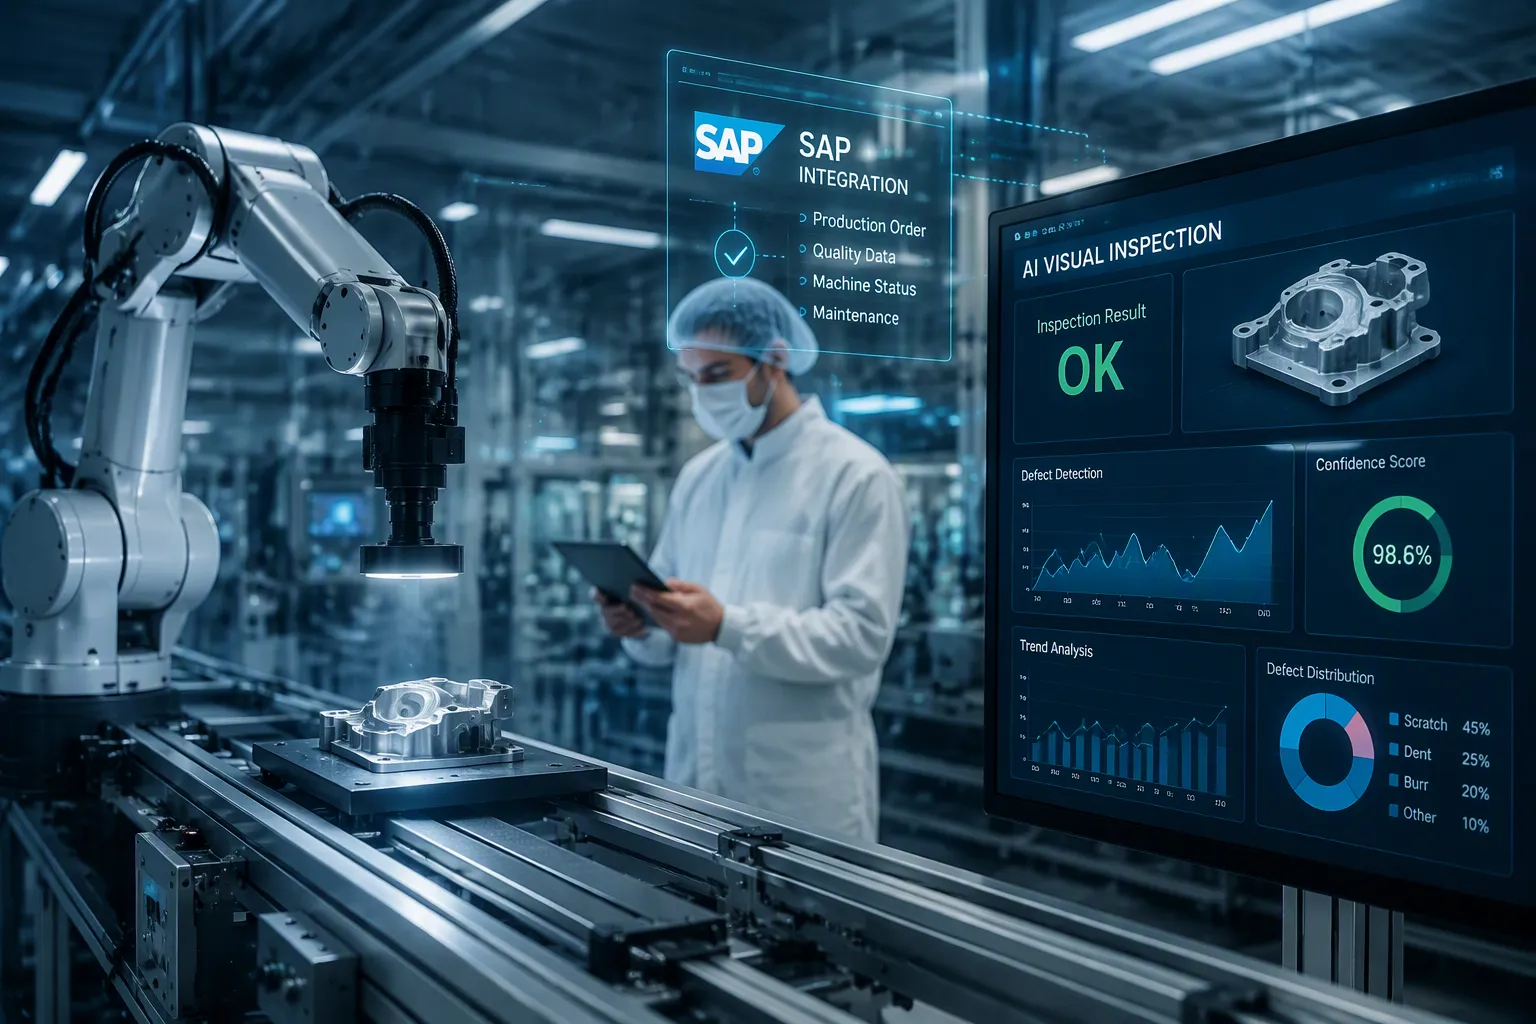
AI-powered computer vision solutions integrate directly with SAP Digital Manufacturing. This connection accelerates processes and ensures seamless data flow to MES and ERP systems. You move beyond static dashboards into intelligent automation. The SAP Business Technology Platform provides the foundation for this integration. It unifies analytics and AI services across your manufacturing operations.
Your automated visual inspection system generates valuable production data with every cycle. Aggregated inspection results combine with process parameters and environmental conditions. AI models analyze these patterns to predict when quality problems will emerge. You adjust processes before defects occur rather than catching them afterward.
Consider a precision component manufacturer facing unpredictable defect rates. AI analysis revealed correlations between ambient humidity, raw material batch properties, and quality outcomes. Engineers had never identified these connections manually. By monitoring these factors and adjusting process parameters proactively, defect rates dropped by 40%. This predictive capability transforms your quality control approach entirely.
The SAP Business Data Cloud enriches this analysis. It integrates shop floor data with context from procurement, sales, and finance. AI models train on complete information rather than isolated inspection results. Embedded AI agents like the "Shop Floor Supervisor" proactively reason and act within your manufacturing context. Joule serves as a generative interface, letting operators ask questions in natural language and receive contextual insights instantly.
Enhancing Customer Trust and Brand Reputation
Transparent quality data creates measurable competitive advantage. Over 35% of every US demographic group says transparency greatly impacts their purchase decision. An additional 32% or more say transparency somewhat increases their likelihood to buy. Quality seals and readily available detailed inspection information serve as leading transparency signals.
Access to a Certificate of Analysis or proof of product testing strongly influences purchasing decisions. Your integrated system generates these documents automatically. Customers see your commitment to quality through verifiable data. This transparency builds lasting trust that competitors cannot easily replicate.
One large-scale manufacturer discovered late deliveries were eroding client trust. Fragmented data across production, shipping, and client systems caused the problem. By building a centralized data hub, the company gained real-time visibility into delays. They identified bottlenecked product lines and shifted from reactive damage control to proactive management. This restored client trust by addressing issues before escalation.
Your system integration creates marketing differentiation through demonstrated quality. Share inspection statistics with customers. Show them your detection accuracy and defect prevention rates. This transparency positions your brand as trustworthy and reliable. The integration you build today becomes your strongest selling proposition tomorrow.
Integrating visual inspection data delivers real-time visibility, reduces operational waste, and empowers data-driven decisions. This integration transforms quality from an IT upgrade into a strategic initiative. Integration compounds returns across your business lifecycle. Integration enables predictive insights. Integration strengthens supplier negotiations. Integration creates competitive differentiation.
Pilot projects demonstrate measurable results. Yield increases reach 2–3 percentage points. Returns drop by 50%. Paint rework decreases 35%. Most manufacturers achieve payback within 12 months.
Automated visual inspection powers proactive maintenance. Automated visual inspection improves detection accuracy. Automated visual inspection reduces defect-related rework. Automated visual inspection builds customer trust through transparent inspection records.
Evaluate your current inspection workflow. Identify integration points. Start with a pilot project. Choosing compatible tools requires effort. The long-term gains justify the investment.
FAQ
How quickly does visual inspection integration pay off?
Most manufacturers see payback within 12 to 24 months. High-volume lines achieve returns in 5 to 8 months. One automotive supplier recovered their $450,000 investment in about 7 months. The integration pays for itself through reduced scrap and rework.
Which ERP systems connect with visual inspection tools?
SAP and Oracle work well with modern inspection software. The integration uses APIs for bidirectional flow. Your ERP pushes work orders to the inspection system. The system sends results back automatically. This integration creates one source of truth. Your data flows without manual entry.
Does integration require new production equipment?
No. Most existing cameras and sensors connect through standard protocols. The integration layer bridges your current hardware to your ERP. You keep your equipment. You add software that unifies the flow. This approach minimizes capital expense. Your inspection accuracy improves without replacing hardware. This inspection setup works with your current line.
How does integration improve recall response?
Digital traceability narrows recall scope by 60-80%. One case reduced a recall from 14,000 cases to 2,100 cases. The integration links every part to its inspection record. You identify affected batches instantly. This prevents broad recalls. Your timestamps show exactly which parts moved where.
What is the first step toward integration?
Start with a pilot project. Choose one production line. Define your data mapping. Select compatible tools. The journey begins small. You measure results. You expand to other lines. This integration reduces risk. Your inspection workflow transforms gradually. Quality improves with each cycle.
See Also
Modern EDI Tracking Enhances Real-Time Cargo Monitoring
Progress in EDI Tracking Boosts Supply Chain Transparency
Advanced Warehouse Technologies Transforming Modern Logistics Operations
Warehouse Audits Are Essential For Operational Efficiency Gains
Analytics Guides Smart Product Selection And Assortment Planning